Building Griot Nano 1: Lessons from 44,000 Hours of Multilingual Speech Training
How we built and evaluated an open-source, locally deployable speech-recognition model for Akan, Dagbani, Ewe, Ghanaian English, and Ga.
Building Griot Nano 1: Lessons from 44,000 Hours of Multilingual Speech Training
Griot Nano 1 began with a broad goal: build one practical speech-recognition model for Akan, Dagbani, Ewe, Ghanaian English, and Ga that can run locally.
After 44,000 accumulated audio-hours of training, the resulting 153-million-parameter Conformer CTC model performed well across all five languages, but not equally. Dagbani, Ga, and Ewe produced the strongest results. Ghanaian English (by this I mean Ghanaian-accented English and a mixture of local languages, which produces a distinct dialect) followed, while Akan remained the lowest-quality language in the group.
That difference shaped the investigation, but it is not the whole story of the model. We had to get the architecture, multilingual data mixture, batching, memory behavior, evaluation, and training economics right before we could make useful comparisons between languages. Once the multilingual baseline was stable, we used Akan as the hardest test case: more exposure, LoRA adaptation, full-model fine-tuning, higher learning rates, and tokenizer changes. Most of those experiments did not improve it.
Those runs were still valuable. Each one ruled out a plausible explanation and helped us separate a model-capacity problem from a data-and-supervision problem.
This is the full technical story of how we built and evaluated Griot Nano 1, what we learned across its five languages, and why Akan needs the most work.
The model, in brief
Griot Nano 1 is a roughly 153-million-parameter Conformer trained with a character-level CTC objective. Its encoder contains 24 Conformer blocks with:
- A 512-dimensional hidden representation
- Eight attention heads
- 2,048-dimensional feed-forward layers
- Convolution modules with a kernel size of 31
- Layer normalization in the convolution path
- Flash-preferred scaled dot-product attention
- BF16 mixed-precision training
The tokenizer contains the Latin alphabet, digits, spaces, limited punctuation, and Ghanaian characters used by the supported languages, including ɛ, ɔ, ŋ, ɖ, ƒ, ɣ, ʋ, and ʒ.
Training uses frame-budget batches rather than a fixed sample count. That matters because a step of short recordings is not equivalent to a step of long ones. We therefore track audio-hours processed rather than treating step count as the main measure of progress.
Training and evaluation methodology
The model was trained as a single multilingual system rather than as five independent recognizers. Each update contributes to a shared acoustic representation, while the sampling mixture controls how often the model encounters each language.
The dataset snapshot used for this work contained approximately 4,426 hours in the training split, 244 hours in validation, and 261 hours in the held-out test split. Based on the per-source duration accounting, the language distribution was approximately:
| Language | Train hours | Validation hours | Test hours |
|---|---|---|---|
| Akan | 861.7 | 47.4 | 58.0 |
| Dagbani | 124.5 | 7.0 | 6.9 |
| Ewe | 298.3 | 16.5 | 17.0 |
| Ghanaian English | 2,985.1 | 164.9 | 165.8 |
| Ga | 156.0 | 8.5 | 12.8 |
These are corpus hours, not the number of hours processed during optimization. The 44,000-hour figure in the title is accumulated training exposure: every time an utterance is sampled again, its duration contributes again. Under our dataset accounting, that works out to approximately ten passes through the training corpus, although weighted sampling means the exposure is not distributed uniformly across languages.
Our final methodology had several important parts:
- Frame-budget batching, so batches are constrained by the amount of audio rather than a fixed number of recordings
- Progress measured in actual, unpadded audio-hours rather than raw training steps
- A controlled multilingual sampling mix with live measurements of the records actually emitted
- Character-level CTC training with one shared vocabulary covering all five languages
- Per-language validation, so improvement in a high-resource language cannot hide regression in another
- A full held-out test evaluation spanning 99,547 recordings
- Raw greedy CTC decoding for the reported baseline, without a language model correcting the acoustic model’s output
That last choice is deliberate. A decoder such as KenLM can improve spelling and word boundaries, but it can also make the underlying acoustic model look stronger than it is. Greedy decoding gives us a cleaner view of what Griot Nano itself has learned. It also gives future users a reproducible baseline: decoding improvements can be measured separately from acoustic-model improvements.
First problem: memory that appeared to grow forever
Early H100 runs began near 20 GB of VRAM, climbed toward 50 GB, and eventually ran out of memory after thousands of steps. It looked like a classic tensor-retention leak. Before calling it one, though, we needed to separate GPU allocator behavior, changing sequence lengths, attention-backend selection, and batch construction.
We added Stormlog memory instrumentation to the trainer and recorded allocator activity, peak memory, and out-of-memory flight-recorder data. We also made the selected SDPA backend visible at startup.
After correcting the training setup, later runs stabilized instead of continuously expanding. Representative peaks were approximately:
- About 25 GB for the full model under the tested frame budget
- About 17 GB for the rank-32 LoRA configuration
The lesson was straightforward: a GPU dashboard was not enough. We needed allocator-level evidence and consistent batch measurements before calling the behavior a leak.
H100 versus A100: optimize for results, not hourly price
The H100 cost more per hour than the available A100 instances, but it processed our workload substantially faster. The right comparison was not hourly price; it was the cost required to process a fixed number of audio-hours or reach the next evaluation.
The A100 40 GB was useful for architecture validation and memory checks. It could hold the stabilized model and cheaply answer questions such as:
- Does the code run?
- Does Flash attention activate?
- Does the model fit within the expected memory envelope?
- Does a configuration reach an evaluation without failing?
The H100 was more attractive for full training and repeated ablations because higher throughput shortened the feedback cycle. Fast experiments matter. A more expensive accelerator can still be the cheaper choice if it gets you the same evidence in half the time.
A subtle sampling bug changed what “55% Akan” meant
We wanted training batches to contain approximately:
- 55% Akan
- 30% English
- 5% Dagbani
- 5% Ewe
- 5% Ga
The first weighted sampler selected shards according to language weights. That is not equivalent to selecting records by language when shards contain unequal numbers of examples. A large shard can silently contribute more samples than a small shard even when their shard-selection probabilities are correct.
We changed the loader to select a language for each record and then draw from that language’s record iterator. We also added live language_mix logging. The measured distribution then closely matched the configured probabilities.
The reminder was simple: do not validate a data-weighting system by reading its configuration. Validate the samples it actually emits.
The multilingual baseline
The strongest rescue checkpoint reached an aggregate validation CER of approximately 12.1%. A full raw-model test evaluation covered 99,547 samples:
| Language | Test samples | CER | WER |
|---|---|---|---|
| Akan | 21,435 | 19.27% | 41.67% |
| Dagbani | 5,307 | 7.04% | 23.75% |
| Ewe | 6,820 | 9.66% | 30.76% |
| Ghanaian English | 56,364 | 12.91% | 26.05% |
| Ga | 9,621 | 8.14% | 15.83% |
| Combined | 99,547 | 13.66% | 29.19% |
The test metrics broadly matched training-time validation, so this did not look like overfitting to a small validation subset.
The model’s quality across the five languages was:
- Dagbani: the strongest character-level result at 7.04% CER
- Ga: 8.14% CER and the strongest word-level result at 15.83% WER
- Ewe: 9.66% CER, also comfortably below the combined model average
- Ghanaian English: 12.91% CER across by far the largest test split
- Akan: 19.27% CER and 41.67% WER, making it the clearest area for improvement
These results matter as a set. Griot Nano 1 is not an Akan-only model with four secondary languages; it is a shared Ghanaian multilingual model. The strong Dagbani, Ga, and Ewe results show that the architecture and training method can learn useful representations for languages that are often poorly served by mainstream speech systems. The large Ghanaian English evaluation also gives us evidence that the shared model remains useful on English while learning the other four languages.
At the same time, a combined score of 13.66% CER can conceal the gap between languages. Reporting only that aggregate would make the model look more uniform than it is. Per-language evaluation is what made Akan’s relative weakness impossible to ignore.
Improving transcription quality with KenLM
The results above measure Griot Nano 1 with greedy CTC decoding: at each step, the decoder takes the model’s most likely character without considering whether the completed sequence is linguistically plausible. For higher transcription quality, Griot Nano 1 can instead use beam search with KenLM, a lightweight statistical language model.
KenLM does not alter the acoustic model or make it hear the audio differently. It reranks candidate transcriptions by combining the CTC acoustic score with the probability of the character and word sequence. This is especially helpful when the acoustics support several similar possibilities, including vowel families such as ɛ / e / a and ɔ / o / u, or when the model is uncertain about word boundaries.
On the same multilingual evaluation, KenLM reduced overall WER by 16.76% relative. The clearest measured improvements included:
| Evaluation | Greedy WER | KenLM WER | Relative WER reduction |
|---|---|---|---|
| Combined | 29.19% | 24.30% | 16.76% |
| Dagbani | 23.75% | 14.56% | 38.69% |
| Akan | 41.67% | 36.43% | 12.58% |
| Ga | 15.83% | 13.12% | 17.12% |
Dagbani benefited most among these results, dropping to 14.56% WER. Akan improved to 36.43% WER as the language model used surrounding context to prefer more plausible spellings and word sequences. Ga, already the strongest language by greedy WER, improved further to 13.12%.
The extra decoding step remained near real time in our tests. This makes KenLM a practical option when transcription accuracy matters more than reporting the acoustic model in isolation. We continue to publish the greedy scores as the clean baseline and report KenLM separately, so improvements from the acoustic model and the decoder are not conflated.
That number needs some context. A 19.27% character error rate does not mean the Akan output is simply unreadable. Many predictions preserve enough of the sentence, sound pattern, and context for a multiliterate Akan reader to work out what was meant. But “understandable” and “correct” are not the same thing. Letters may be swapped (especially within related vowel families), characters may be dropped or inserted, and word boundaries may move. A reader can often fill in those gaps; software downstream of the transcription cannot be expected to do so reliably.
This is why we treat Akan as an unresolved quality problem even when an example looks close to a human reader. Search, subtitles, translation, indexing, and language-learning tools all depend on lexical accuracy, not just a sentence being guessable from context.
What the gradient-saliency analysis shows
Aggregate CER and WER tell us how often the model is wrong, but not which parts of the audio most strongly affect its output. To get a qualitative view, we generated input-gradient saliency maps for test samples in each language.
Each figure has two panels. The upper panel is the log-mel spectrogram, with the reference transcript in its title. The lower panel overlays saliency in red and shows the model’s greedy prediction. To produce the saliency, we summed the highest logit at every output frame, backpropagated that score to the input features, and plotted the absolute value of gradient × input feature. Brighter red regions are time-frequency areas where a small change would have a stronger local effect on the model’s selected logits.
These plots are useful for inspection, but they need to be read carefully. They are input-gradient saliency maps rather than layer-level Grad-CAM, despite the analysis folder’s name. Each image is also normalized independently, so brightness cannot be compared quantitatively from one language to another. Saliency shows sensitivity, not a causal proof that one acoustic region explains a particular character.
Akan
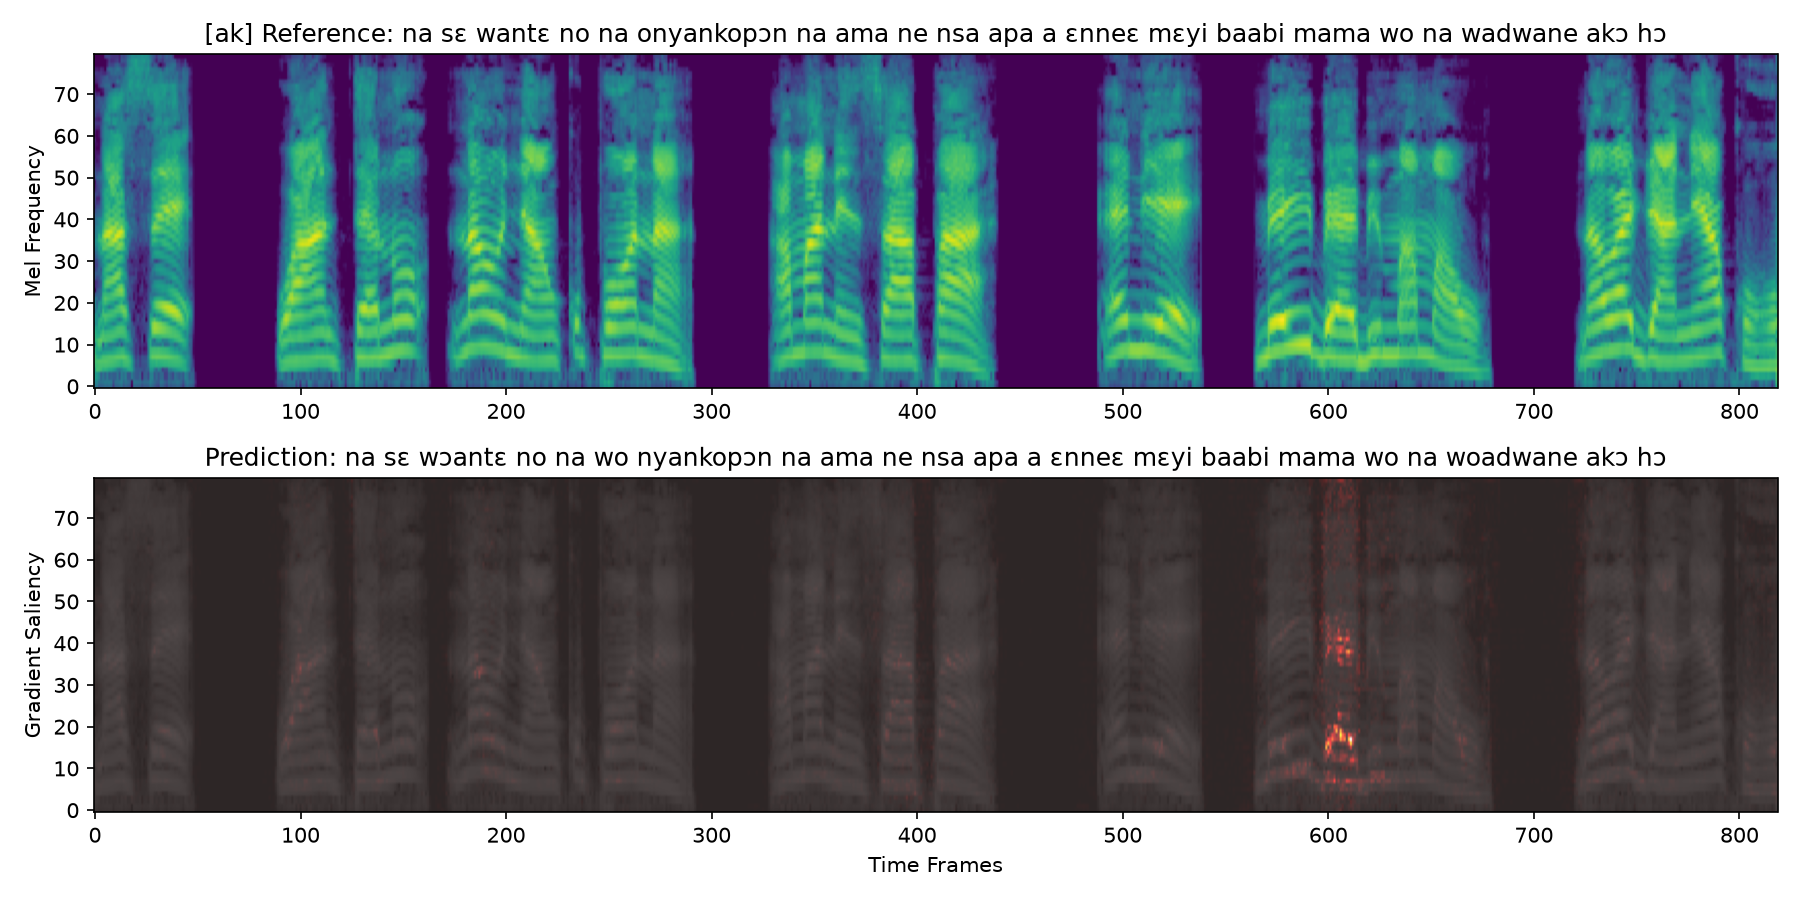
The Akan prediction preserves most of the sentence and is understandable to a multiliterate reader, but it contains the kind of lexical near-misses reflected in the aggregate error analysis: wante becomes wɔante, an extra wo appears before nyankopɔn, and wadwane becomes woadwane. The strongest red concentration occurs around a voiced region near frame 600, while weaker sensitivity is spread across several other speech segments. This is a good example of why human readability can coexist with a high character error rate: the sentence structure survives, but small insertions and vowel changes make the transcript incorrect.
Dagbani
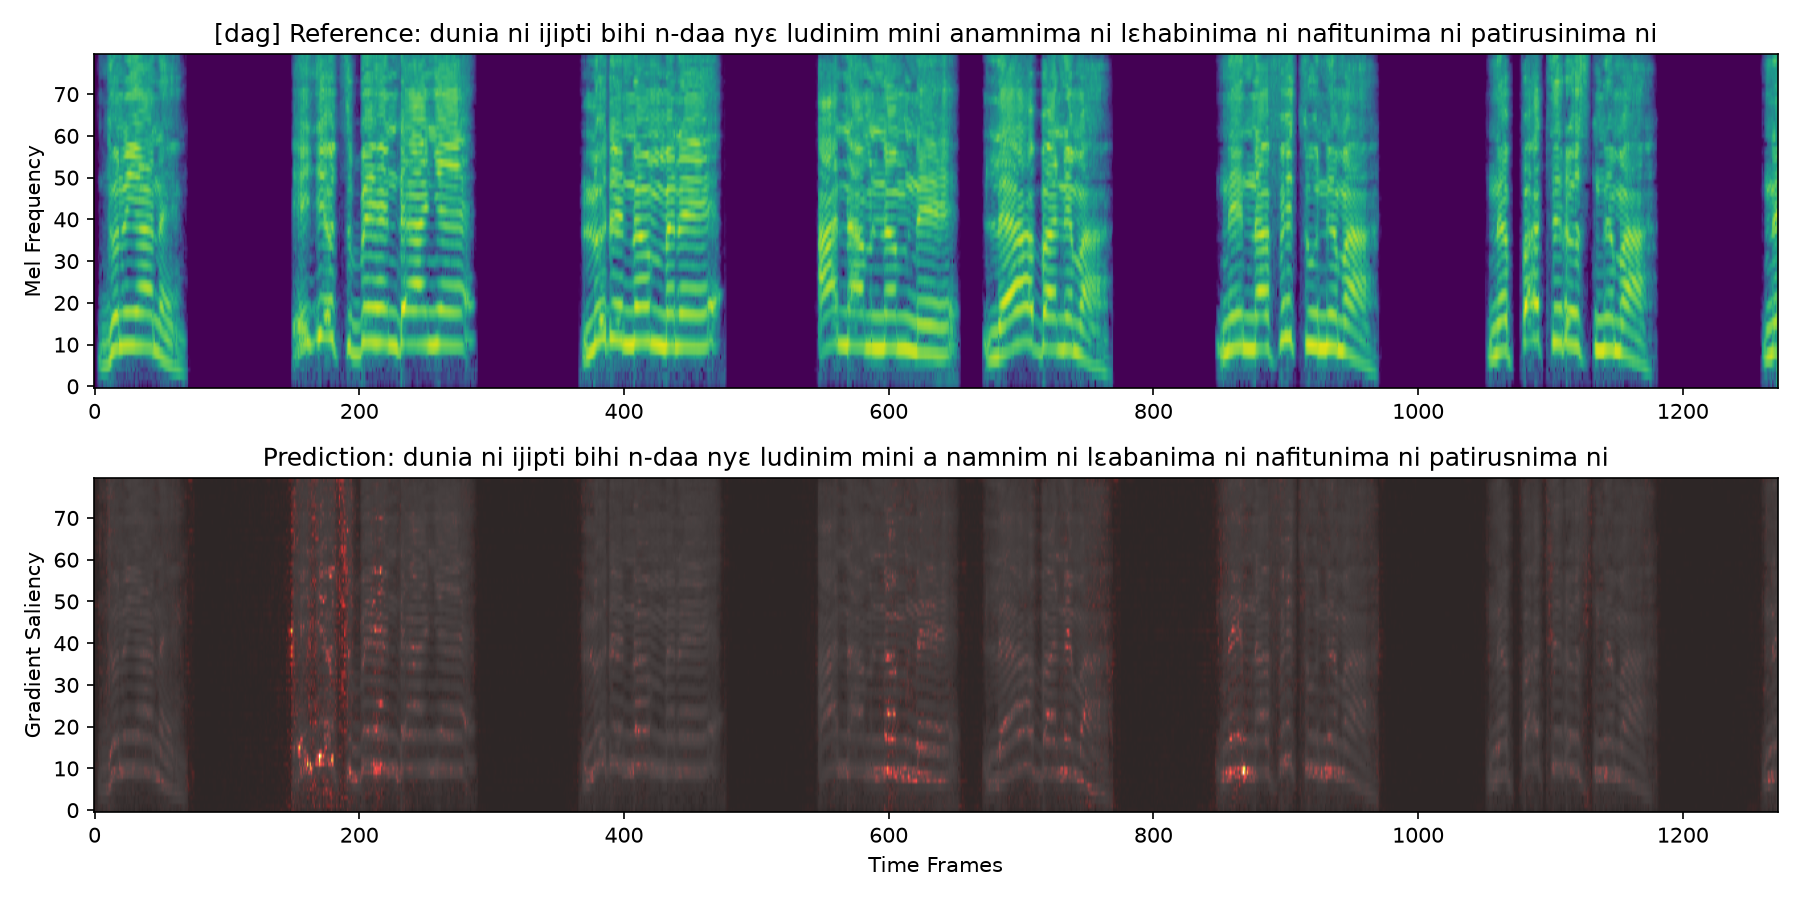
The Dagbani output follows the reference closely over a long utterance, with localized spelling and segmentation differences such as the rendering around anam... and lɛhabinima. Its saliency is concentrated in multiple voiced regions rather than one continuous band, particularly near the earlier speech segment and several later low-frequency regions. The pattern is consistent with a model using distributed acoustic evidence across the utterance while still making a small number of local decoding errors.
Ewe
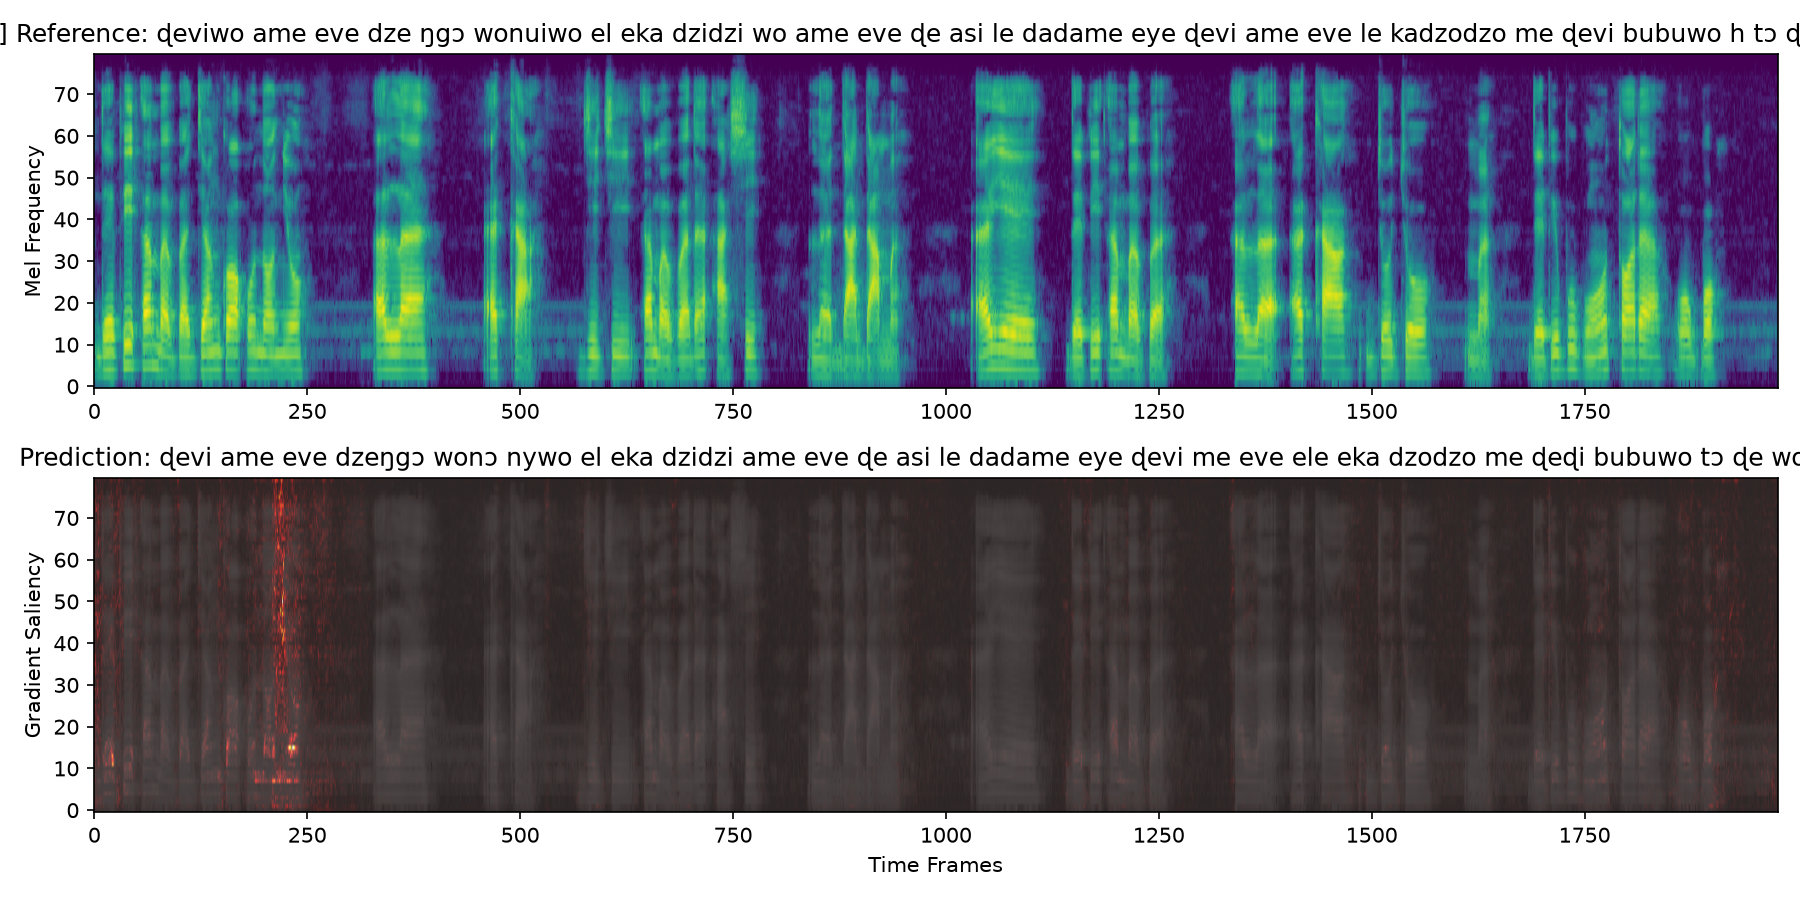
In the Ewe example, the prediction retains much of the reference’s cadence and word sequence but introduces several character substitutions and word-form changes. The saliency has a strong early concentration and smaller responses later in the utterance. This illustrates a limitation of the visualization: it can show where the prediction is locally sensitive, but it does not by itself tell us whether an error came from acoustics, orthographic variation, transcript quality, or the limitations of greedy CTC decoding.
Ghanaian English
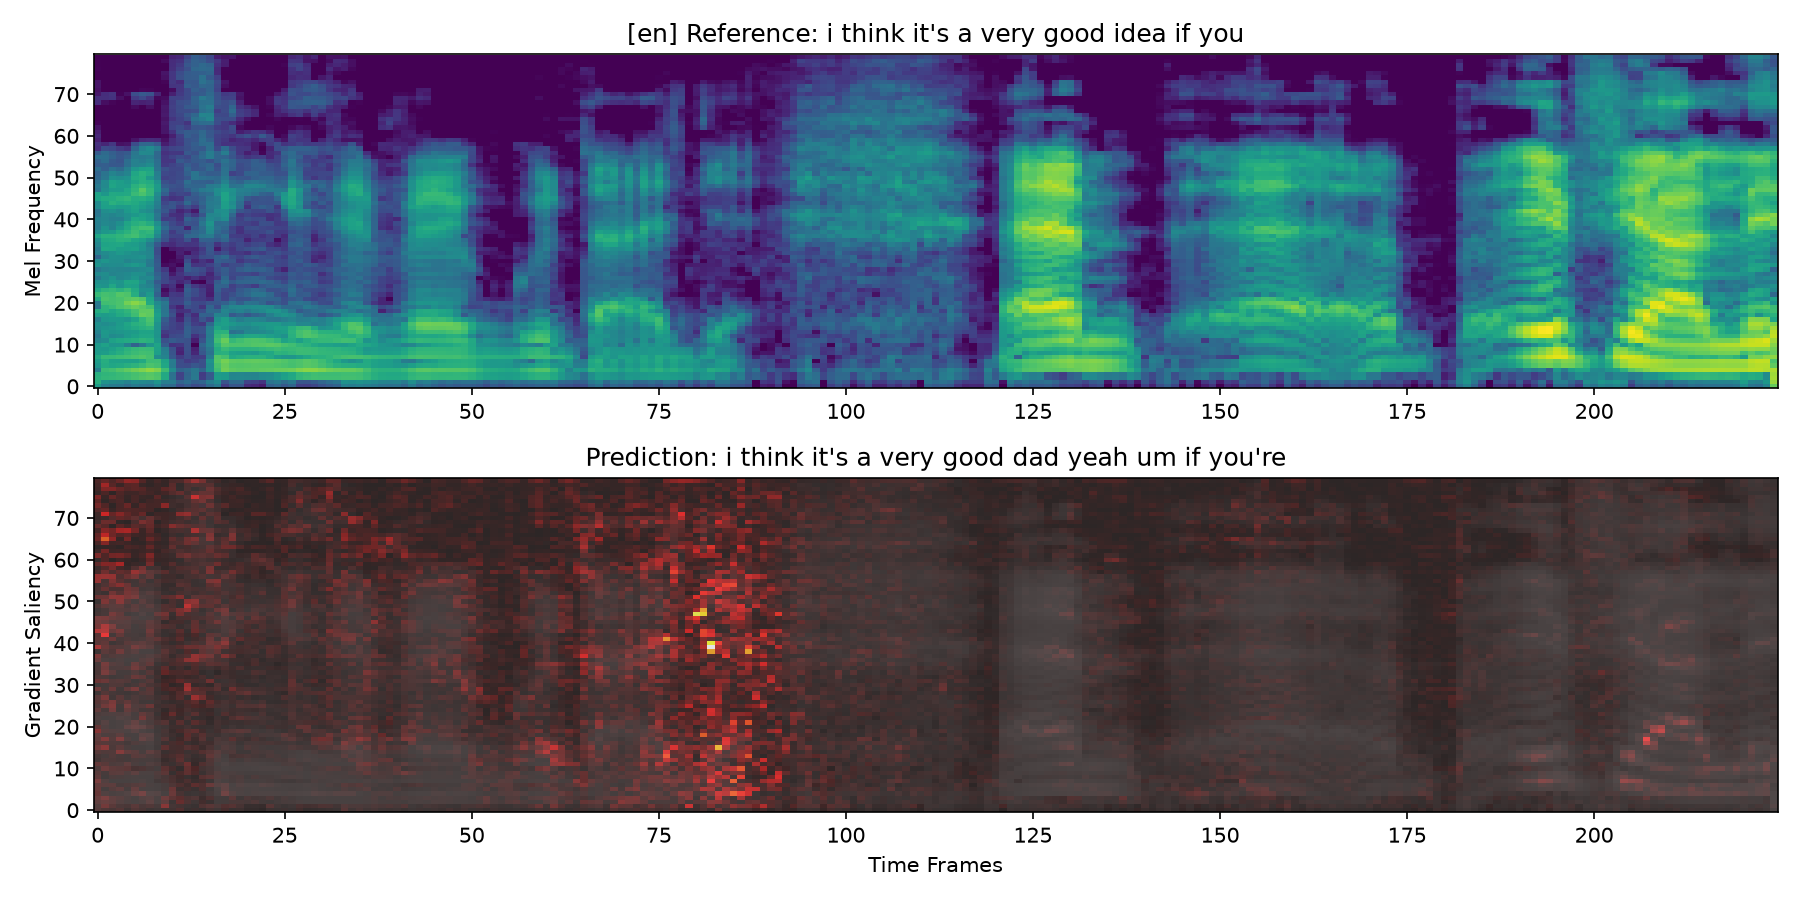
The English reference begins, “i think it’s a very good idea if you,” while the model predicts, “i think it’s a very good dad yeah um if you’re.” The beginning is stable, but the middle of the phrase diverges enough to alter its meaning. The brightest saliency is also concentrated around that middle region, near frames 125–150. This does not prove that the highlighted patch caused the substitution, but it identifies the part of the input where the selected logits are most locally sensitive and where closer audio-level inspection would be most useful.
Ga
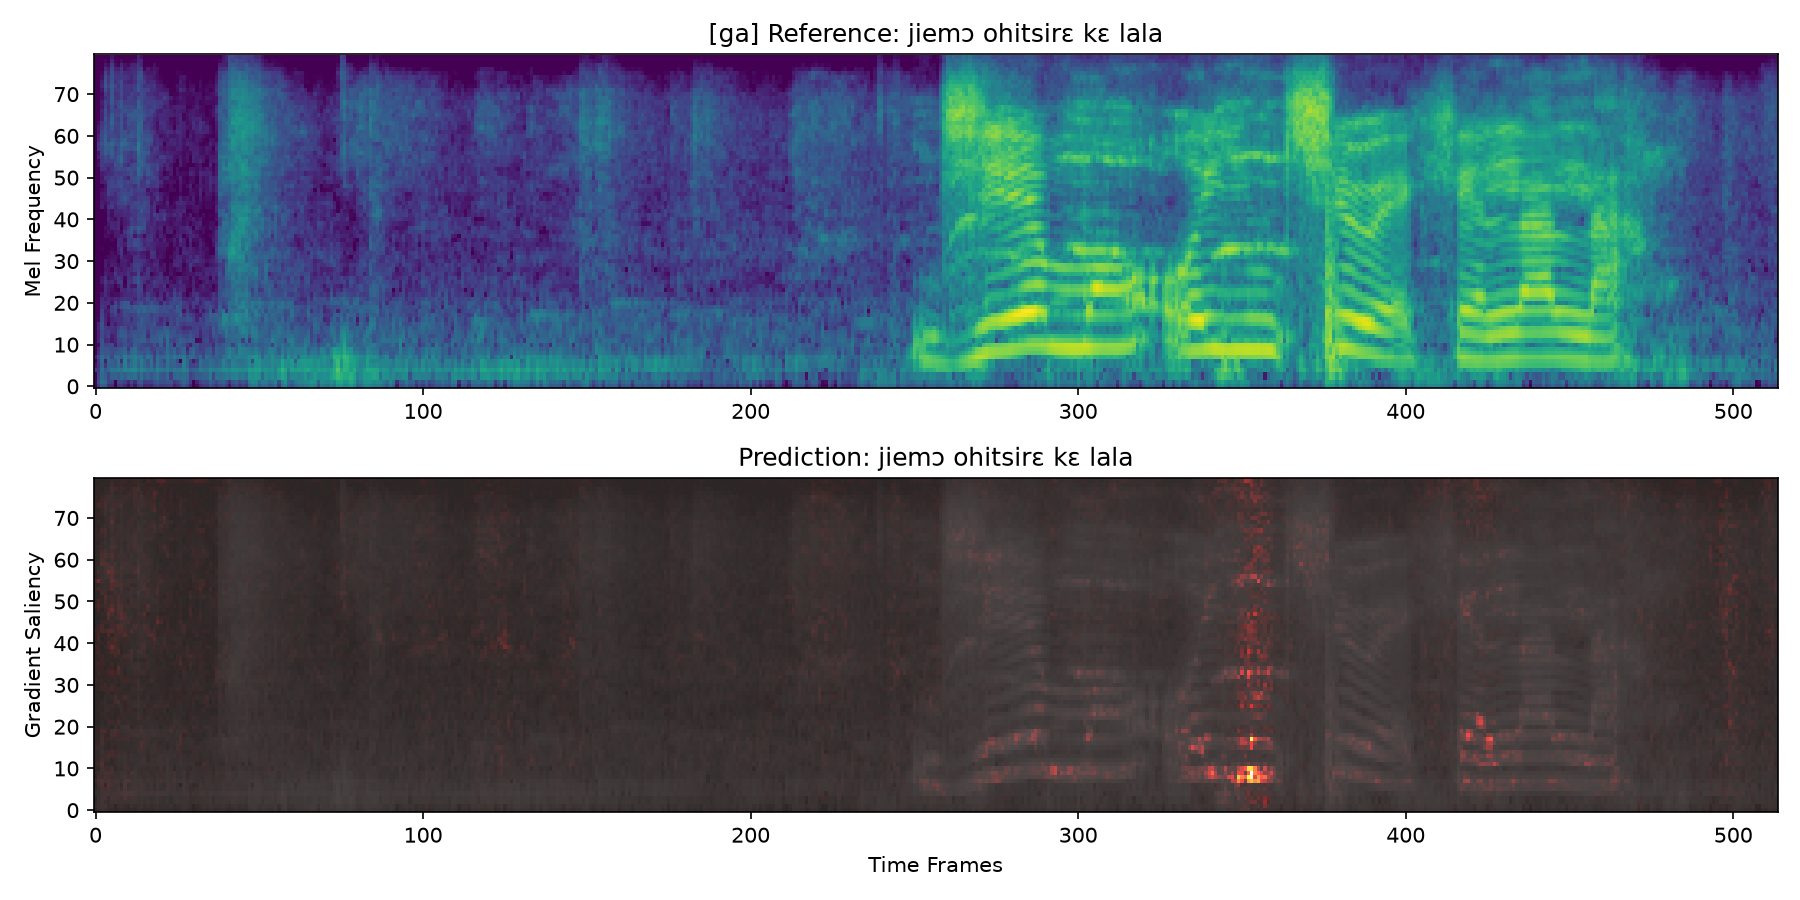
The Ga prediction exactly matches the reference: jiemɔ ohitsirɛ kɛ lala. Saliency is strongest around a compact voiced transition near frame 350, with smaller responses over later syllabic regions. An exact transcript does not mean every part of the signal contributed equally; this plot suggests that a relatively small set of time-frequency regions had the strongest local influence on the model’s confidence for this utterance.
Taken together, the five examples reinforce the quantitative results without replacing them. The model can produce exact output, close readable output, and meaning-changing errors across different utterances. The saliency maps help us choose where to inspect the audio and model response next, while the full test-set CER, WER, and character alignments remain the stronger evidence for comparing language quality.
Why we focused the deeper investigation on Akan
Akan was not singled out because it was the only language that mattered. It was singled out because it had the lowest measured quality and therefore gave us the clearest way to test the limits of the model and methodology.
The central question was whether Akan needed more optimization, more model capacity, better tokenization, or better data. The following experiments were designed to isolate those possibilities while continuing to measure the effect on Dagbani, Ewe, Ghanaian English, and Ga.
Akan investigation one: conservative multilingual continuation
We first tried continuing the full model with a conservative learning rate while increasing Akan exposure. This preserved multilingual ability reasonably well, but Akan CER remained near 19–20%.
The model was still training, but the metric we cared about was not moving meaningfully. More steps alone were not an answer.
Akan investigation two: LoRA adaptation
Next, we implemented native PyTorch LoRA inside the Conformer framework. The trainer supported:
- Adapter injection into selected linear layers
- Adapter-only checkpoints
- Base-checkpoint identity verification
- Discriminative learning rates
- Resuming from saved adapters
- Merging adapters into the base model
- Per-language checkpoint metrics and regression guards
One experiment used rank-32 attention adapters across all 24 encoder blocks, fully unfroze the top two blocks, and unfroze the convolution module in the third block from the top. This made 15.31 million of 155.45 million parameters trainable (about 9.85% of the adapted model).
The configuration was deliberately targeted: global attention adapters could adjust representations throughout the network, while upper blocks and convolution modules could adapt higher-level acoustic and language-specific features.
It still did not solve Akan.
Across 10,000 steps, Akan CER moved only from roughly 19.21% to 18.98%. The change was too small to justify calling it a meaningful improvement.
Akan investigation three: Akan-only LoRA
Perhaps English and the other Ghanaian languages were consuming too much of the update budget. We changed training to 100% Akan while retaining balanced validation across all five languages.
That experiment also plateaued. At step 7,000:
- Akan CER was 18.98%
- English CER was 11.34%
- Aggregate non-Akan CER crossed its regression guard
The adapters had enough exposure to Akan, but more exposure to the same examples was not producing new capability.
Akan investigation four: full-model fine-tuning
The strongest test of the capacity hypothesis was to remove LoRA entirely and train all 153 million parameters on Akan.
We started from the same rescue checkpoint, reset the optimizer and training clock, and used a schedule that warmed toward a peak learning rate of 3e-4. If adapters were the bottleneck, full-model training should have revealed it.
Instead, performance deteriorated as the learning rate increased:
| Step | Learning rate | Akan CER | Combined CER |
|---|---|---|---|
| Baseline | - | ~18.98% | ~12% |
| 2,000 | 6e-5 | 19.08% | 12.82% |
| 4,000 | 1.2e-4 | 20.07% | 16.14% |
| 6,000 | 1.8e-4 | 24.03% | 28.88% |
This was catastrophic forgetting, but the most revealing detail was that Akan itself worsened. The model was not trading multilingual performance for better Akan. It was losing both.
That result made the conclusion much stronger: LoRA capacity was not the primary bottleneck.
Was the tokenizer missing Akan characters?
Before blaming the data, we audited every Akan training transcript against the tokenizer. The full audit covered 264,553 samples.
The result was unambiguous:
- Vocabulary size: 50
- Unknown characters after normalization: zero
- Empty transcripts after normalization: 49
- Raw characters inspected: 33,755,204
- Normalized characters: 32,634,178
Every character reaching the CTC loss existed in the vocabulary.
Most stripped characters were punctuation: periods, commas, question marks, quotation marks, and similar symbols. A small number of orthographic variants also appeared. One was ↄ, a reversed-c character visually similar to the open-o character ɔ used by the tokenizer.
We added the normalization mapping:
ↄ → ɔOnly 297 occurrences were affected across the full Akan corpus. As expected, a matched retraining run produced no measurable CER improvement. The mapping was correct, but it was not the missing breakthrough.
What characters does the model actually confuse?
We saved predictions for the complete test set and aligned every reference and hypothesis at the character level. The analyzer reproduced the aggregate evaluation CER to within a few thousandths of a percentage point.
For Akan alone:
| Error type | Count | Share of edits |
|---|---|---|
| Substitutions | 121,475 | 30.2% |
| Deletions | 154,362 | 38.4% |
| Insertions | 126,289 | 31.4% |
| Total | 402,126 | 100% |
The errors were not caused by one broken token. They formed recognizable acoustic and orthographic families.
Vowel confusions
The largest Akan substitution pairs included:
| Reference | Prediction | Count |
|---|---|---|
ɔ | o | 2,972 |
i | e | 2,904 |
e | a | 2,470 |
ɛ | a | 2,422 |
e | ɛ | 2,316 |
e | i | 2,231 |
ɛ | e | 2,085 |
a | ɛ | 1,976 |
o | a | 1,892 |
o | ɔ | 1,802 |
u | o | 1,792 |
The main clusters were:
e / ɛ / i / ao / ɔ / u / an / m
The tokenizer represents these characters correctly. The model has difficulty discriminating them consistently from acoustics and context.
In practice, these substitutions often produce text that looks close to the intended Akan. A multiliterate reader may recognize the sound pattern and mentally restore the correct word, much as a reader can understand a familiar word with two letters swapped. The transcription is still lexically incorrect, however, and repeated near-misses accumulate quickly in a full utterance.
Character-specific error rates
Among common Akan characters, several had notably high reference-side error rates:
| Character | Reference occurrences | Errors | Error rate |
|---|---|---|---|
ɛ | 108,808 | 21,092 | 19.38% |
u | 46,791 | 8,680 | 18.55% |
e | 138,056 | 24,719 | 17.91% |
r | 55,842 | 9,917 | 17.76% |
ɔ | 62,140 | 11,006 | 17.71% |
h | 39,567 | 6,729 | 17.01% |
w | 59,635 | 9,595 | 16.09% |
y | 64,165 | 10,268 | 16.00% |
i | 89,365 | 14,152 | 15.84% |
The Akan-specific vowels ɛ and ɔ are difficult, but the problem is broader than those two symbols.
Word boundaries matter
Spaces accounted for at least:
- 30,306 deletions
- 26,645 insertions
That is 56,951 direct word-boundary edits, or roughly 14.2% of all Akan character edits before counting substitutions involving spaces.
A language model may improve this portion of decoding, but it would not change the raw acoustic model. We intentionally report raw greedy CTC results so acoustic progress is not hidden by KenLM.
Word-boundary errors have a similar human-versus-machine effect. A person can often infer where one word ends and another begins. A subtitle renderer, search index, or translation system receives the literal output. For those systems, a readable approximation is not enough.
What those experiments told us
The combined evidence rules out several attractive but incorrect explanations:
- The tokenizer is not missing the characters used during training. Post-normalization OOV count was zero.
- LoRA rank is not the central limitation. Larger adapters and selectively unfrozen encoder blocks did not materially improve Akan.
- More Akan exposure is not automatically better. Akan-only LoRA plateaued, and Akan-only full fine-tuning made Akan worse.
- The validation subset is not hiding a dramatic overfit. Full-test performance was consistent with validation.
- Higher learning rate is not unlocking a new basin. It rapidly destroyed both multilingual and Akan performance.
The remaining explanation is not simply “the model needs more training.” The limiting signal is likely a mixture of:
- Transcript inconsistency
- Dialect variation
- Acoustic ambiguity
- Recording quality
- Source-specific label noise
- Word-boundary conventions
- Insufficient clean examples for difficult vowel contrasts
These are still hypotheses, not proven causes. The next useful work is source-level data analysis and manual review, not another blind optimizer sweep.
Finishing Griot Nano 1
The strongest checkpoint contained 41,071.57 accumulated audio-hours at step 104,000. We added an exact audio-hour stopping condition and scheduled a final multilingual polish to 44,000 audio-hours (approximately ten passes under our dataset accounting).
This final phase retains:
- Full-model training
- The proven multilingual sampling mix
- Existing optimizer and scheduler state
- No SpecAugment
- Balanced multilingual validation
- Raw greedy CTC evaluation
The goal is no longer to force an Akan-only breakthrough. It is to finish a stable Griot Nano 1 model that we understand well.
The broader lesson
The most valuable outcome of an experiment is not always a lower error rate.
We began with a model that appeared to need more Akan training. After several controlled failures, we learned something more precise: the model already sees the relevant characters, has enough trainable capacity, and does not improve when repeatedly shown the same Akan distribution. Its remaining errors have structure (especially vowel families and word boundaries), and that structure points toward data quality, transcription consistency, and better-targeted supervision.
That is more useful than another unexplained checkpoint.
When we publish Griot Nano 1, the headline numbers will matter. But so will the experiments that prevented us from claiming progress where there was none.
Open sourcing Griot Nano 1 is part of that same commitment. It lets others inspect these limitations, reproduce the evaluations, improve the data and decoding, and adapt the work rather than having to trust a closed benchmark number.
It also makes local deployment possible. Ghanaian speech technology should be useful in places with limited connectivity, under real privacy constraints, and without making every developer or institution dependent on a permanent cloud bill. A model that can run on hardware people control creates room for offline transcription, private workflows, local-language products, and research led by the communities the model is intended to serve.
The model is not finished because it is open source. Open source is how we make its current strengths and weaknesses visible and invite more people to help move it forward.
Find it on Hugging Face
Griot Nano 1 is released under CC BY-NC-SA 4.0 on Hugging Face, with the training code, inference scripts, metrics, and license audit in the model repo:
- Qlerqly/griot-nano-1 — the 153M-parameter Conformer CTC checkpoint, with greedy CTC and live-microphone inference
- Qlerqly/griot-nano-1-kenlm — the KenLM n-gram decoder used for the improved WER numbers above
- Qlerqly/griot-nano-1-onnx — an ONNX export for local, dependency-light deployment
Read about Griot Edge, our smaller streaming model with selectable latency budgets.